Appendix B
The Settings dialog's Dashboard is driven by a watchdog thread that executes on a fixed, 3 second interval. Its purpose is to ensure that each controller is running properly. If not, it will take corrective action to remedy any faults. As with all WAV101 components, the watchdog thread reports its activities through event messages and system event notifications. The watchdog thread also reports the state of each controller with performance counters. Keep in mind that these counters represent either instantaneous values or cumulative counts which are limited to the current session only. They are defined as follows;
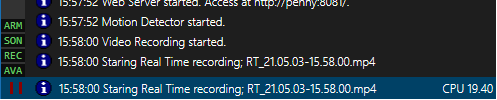
Machine Status IconsMachine status icons include 7 states that are of critical importance to WAV101 operation. Therefore, they are constantly monitored by the watchdog thread and reported when active. Be aware that machine status icons are also displayed on the WAV101 window, the Grid View and remote monitoring tools. Machine status icons are defined as follows;
BAT: active when the PC is running on battery power.
ARM: active if both the motion detector and motion alarms are enabled.
SON: active if both the motion detector and sonic alarms are enabled.
MVA: active if both the motion detector and machine vision alarms are enabled.
PAN: active if any user triggers the panic alarm.
REC: active if any type of recording is occurring.
AVA: active if an AV alert is present on the host machine.
The Host performance counters report operating system values. Note that the machine name is the PC's network name. WAV101 uses it to identify the host remotely and as the source of its notifications. If required, refer to the Windows' Settings \ System \ About page to "Rename the PC".

CPU: reports the CPU usage for all processes.
Memory: reports the (RAM) memory usage for all processes.
Disk: reports the disk space usage for the Windows' partition.
Battery: if applicable, reports the battery level as a percentage.
The WAV101 performance counters report application specific values, including the session's uptime. Note that WAV101 Uptime counters use the concise form of the D:HH:MM:SS pattern.
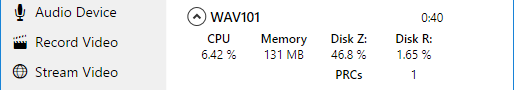
CPU: reports the CPU usage for the application and its spawns.
Memory: reports the (RAM) memory used by the application and its spawns.
Disk: reports the disk space usage for the root folder's partition.
Disk: reports the disk space usage for the cache folder's partition. 1
PRCs: reports the number of processes for the application and its spawns.
Notes:
1. Only visible if cache and root folders are located on different partitions.
The Media performance counters quantify the capability of the Video, Audio and Recording controllers. On the other hand, the Capacity performance counter is the theoretical frame rate as a function of the host machine's processing period. Note that the status icon reflects the current state of all three controllers with respect to the profile's configuration.
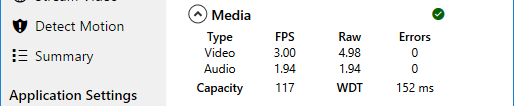
FPS: reports the frame rate consumed by the controller.
Raw: reports the frame rate delivered to the controller.
Errors: maintains the error count for the controller.
Capacity: reports the host's maximum achievable frame rate.
WDT: reports the duration of the watchdog thread's previous round.
The Alarms performance counters report the number of unique alarm events processed by the motion detector. A unique alarm event is defined by the sustained violation of the respective alarm level boundaries. On the other hand, a unique panic alarm follows its assertion cycle. Note that the status icon reflects the current state of motion detector.

Motion: reports the alarm count as defined by the motion detector.
Sonic: reports the alarm count as defined by the audio device.
Vision: reports the alarm count as defined by the machine vision feature.
Panic: reports the number of panic alarm assertions.
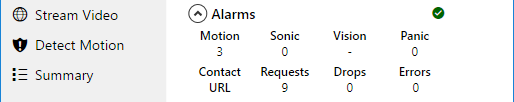
Contact URL 1
Requests: reports the total number of requests attempted.
Drops: reports the number requests dropped while busy.
Errors: reports the number of failed HTTP requests.
Notes:
1. Performance counters are only displayed if the feature is enabled.
The SMTP Mail performance counters report the number of messages processed by the SMTP controller. It does not make any further distinction between the types of mail messages. Note that the status icon reflects the current state of SMTP Mail controller.

Mail: reports the number of Mail messages dispatched.
SMS: reports the number of SMS messages dispatched.
Queue: reports the number of messages pending delivery.
Errors: reports the number of undeliverable messages.
The Cache Management performance counters detail information related to the processing of video recordings. Where possible, operations are queued and performed sequentially to distribute system loading. Note that the status icon reflects the state of Cache Manager.
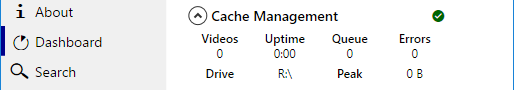
Videos: reports the number of video recordings encoded.
Uptime: reports the cumulative elapsed time to assemble the cached fragments.
Queue: reports the number of video recordings pending assembly.
Errors: reports the number of failed assemblies.
Drive: reports the cache folder's target drive.
Peak: reports the cache folder's peak usage.
The File Management performance counters detail information related to the processing of recordings, snapshots and log files. Where possible, operations are queued and performed sequentially to distribute system loading. Note that the status icon reflects the state of File Manager. Keep in mind that the yellow status icon is displayed during index rebuilds.
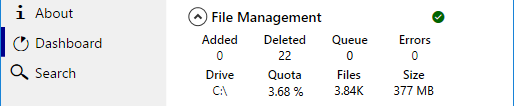
Added: reports the number of items added to the files index.
Deleted: reports the number of items removed in violation of the disk quota.
Queue: reports the number of files pending deployment.
Errors: reports the number of failed add and remove operations.
Drive: reports the root folder's target drive.
Quota: contextually reports the root folder's disk space usage. 1, 2, 3
Files: reports the number of files contained within the root folder.
Size: reports the root folder's cumulative file size.
Notes:
1. The counter's definition is dependent on the state of Disk Quotas.
2. If enabled, the counter displays the Quota usage.
3. If disabled, the counter displays the Disk space usage.
The web server performance counters are limited to its activity only. They in no way include any reference to the bandwidth consumed by the Video Controller with IP cameras, Audio Controller with IP microphones or between Contact URL feature and its interface. Note that the status icon reflects the state of web server as defined by the Stream Video page.
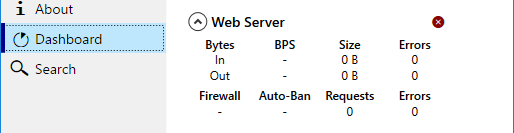
BPS: reports the bandwidth in Bytes per Second.
Size: reports the cumulative size of data transferred.
Errors: reports the number of socket errors.
Firewall: reports the number of connections refused.
Auto-Ban: reports the number of IP blocks.
Requests: reports the number of HTTP requests received.
Errors: reports the number of HTTP requests that could not be processed.
S.I. Prefixes
WAV101, as well as, its dashboard use S.I. Prefixes to express large and small numbers in a compact form. As a reminder, possible values include;
| Prefix | Symbol | Multiplier |
| Tera | T | 1E12 |
| Giga | G | 1E9 |
| Mega | M | 1E6 |
| Kilo | K | 1E3 |
| Milli | m | 1E-3 |
| Micro | u | 1E-6 |
| Nano | n | 1E-9 |
| Pico | p | 1E-12 |